91 lines
3.8 KiB
Markdown
91 lines
3.8 KiB
Markdown
# points-on-curve
|
||
|
||
This package calculate the points on a curve with a certain tolerance. It can also simplify the shape to use fewer points.
|
||
This can really be useful when estimating lines/polygons for curves in WebGL or for Hit/Collision detections.
|
||
|
||
## Install
|
||
|
||
From npm
|
||
|
||
```
|
||
npm install --save points-on-curve
|
||
```
|
||
|
||
The package is distributed as an ES6 module.
|
||
|
||
## API
|
||
|
||
### pointsOnBezierCurves(points: Point[], tolerance?: number, distance?: number): Point[]
|
||
|
||
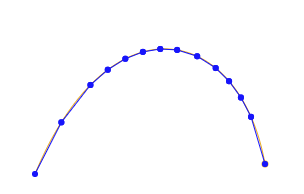
You pass in the points representing a bezier curve. Each point is an array of two numbers e.g. `[100, 123]`.
|
||
|
||
The points can also be a set of continuous curves where the last poing on the `Nth` curve acts as the first point of the next.
|
||
|
||
```javascript
|
||
import { pointsOnBezierCurves } from 'points-on-curve';
|
||
|
||
const curve = [[70,240],[145,60],[275,90],[300,230]];
|
||
const points = pointsOnBezierCurves(curve);
|
||
// plotPoints(points);
|
||
```
|
||
|
||
|
||
|
||
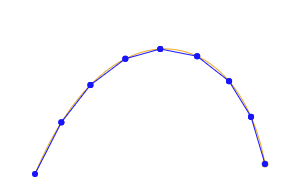
Same can be rendered with more **tolerance** (default value is 0.15):
|
||
|
||
```javascript
|
||
const points = pointsOnBezierCurves(curve, 0.7);
|
||
```
|
||
|
||
|
||
Note that this method does not accept the number of points to render, but takes in a tolerance level which allows for better distribution of points.
|
||
|
||
The value of **tolerance** can be between 0 and 1. It is used to decide how many points are needed in a section of the curve. The algorithm determined the *flatness* of a section of the curve and compares it to the *tolerance* level, if less flat, the segment gets further divided into 2 segments.
|
||
|
||
|
||
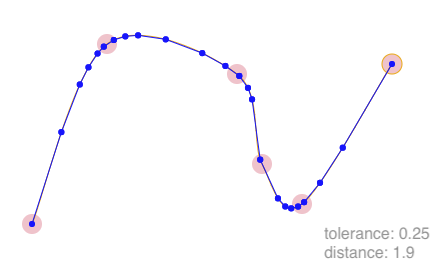
#### Simplifying path
|
||
|
||
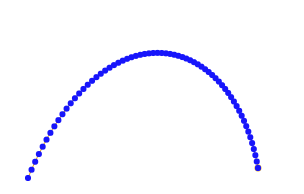
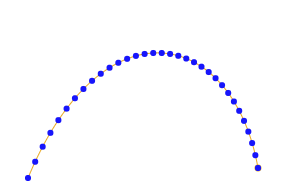
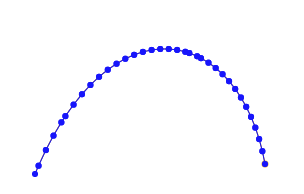
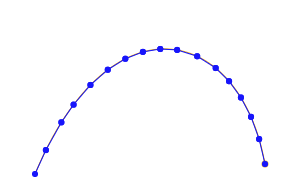
Based on the tolerance alone, this algorithm nicely provides enough points to represent a curve. It does not, however, efficiently get rid of unneeded points. The second *optional* argument in function, **distance** helps with that. If a `distance` value is provided, the method uses the [Ramer–Douglas–Peucker algorithm](https://en.wikipedia.org/wiki/Ramer%E2%80%93Douglas%E2%80%93Peucker_algorithm) to reduce the points.
|
||
|
||
```javascript
|
||
const points = pointsOnBezierCurves(curve, 0.2, 0.15);
|
||
```
|
||
|
||
Following are the points generated with distance values of `0.15`, `0.75`, `1.5`, and `3.0`
|
||
|
||
|
||
|
||
|
||
|
||
|
||
### curveToBezier(pointsIn: Point[]): Point[]
|
||
|
||
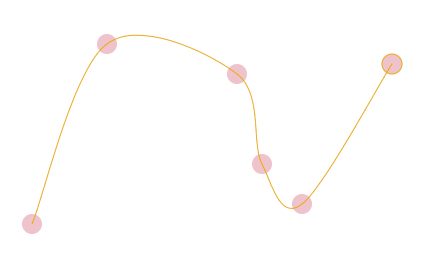
Sometimes it's hard to think of shape as a set of cubic bezier curves, each curve with 2 controls points. It is simple to just think of them as a curve passing through a set of points.
|
||
|
||
This method turns those set of points to a set of points representing bezier curves.
|
||
|
||
```javascript
|
||
import { curveToBezier } from 'points-on-curve/lib/curve-to-bezier.js';
|
||
|
||
const curvePoints = [
|
||
[20, 240],
|
||
[95, 69],
|
||
[225, 90],
|
||
[250, 180],
|
||
[290, 220],
|
||
[380, 80],
|
||
];
|
||
const bcurve = curveToBezier(curvePoints);
|
||
// .. Plot bcurve
|
||
```
|
||
|
||
|
||
Now that we have bezier points, these could be passed to `pointsOnBezierCurves` function to get the points on the curve
|
||
|
||
|
||
|
||
|
||
## License
|
||
[MIT License](https://github.com/pshihn/bezier-points/blob/master/LICENSE)
|
||
|